
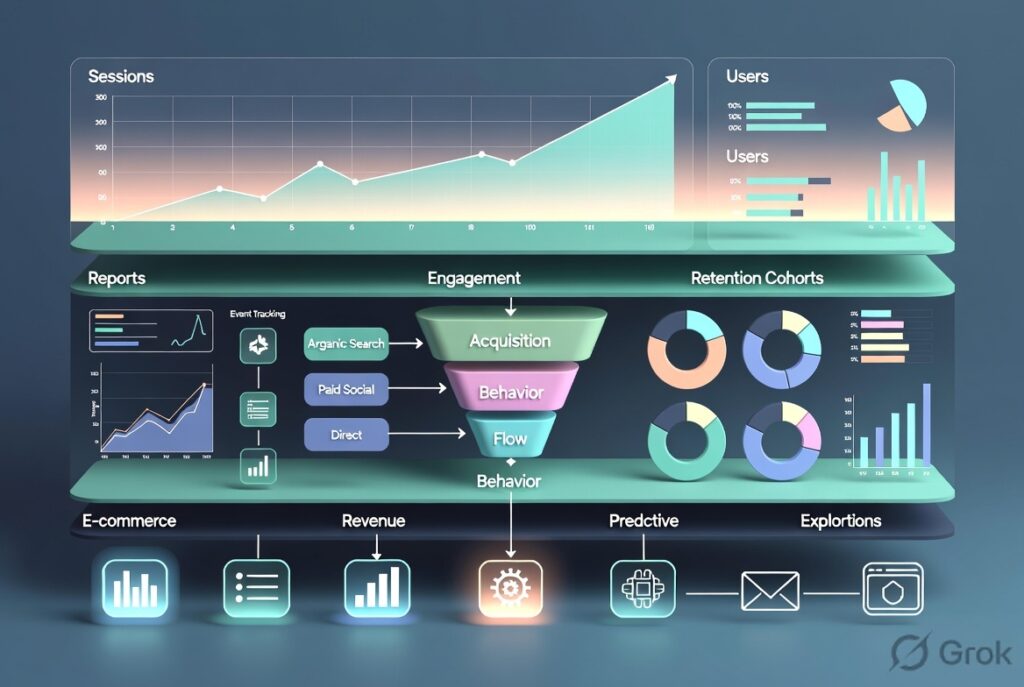
Without data, you can only guess. With Google Analytics 4 (GA4), you no longer have to guess. Instead, you can make smart decisions based on real user behavior.
Imagine this – Your website gets 5,000 visitors every month. However, only a few people contact you, buy your product, or subscribe to your newsletter.
The big question is:
- Where did those visitors come from?
- Which pages did they enjoy?
- Why did they leave?
- Which marketing campaign brought the most customers?
- What should you improve first?
Whether you own a business website, blog, eCommerce store, healthcare website, or digital marketing agency, Google Analytics 4 helps you understand what works and what needs improvement.
In this complete guide, you will learn everything from setting up GA4 to analyzing reports, tracking conversions, and improving your SEO. By the end, you will know how to turn website visitors into loyal customers.
What Is Google Analytics 4?
Google Analytics 4 (GA4) is Google’s free website analytics platform. It helps you understand how people interact with your website or mobile app.
Unlike older versions of Google Analytics, GA4 focuses on events instead of sessions. This gives you a much clearer picture of user behavior.
For example, GA4 can track when someone:
- Visits your website
- Scrolls through a page
- Clicks a button
- Watches a video
- Downloads a PDF
- Fills out a contact form
- Makes a purchase
All these actions become events that you can analyze later.
Instead of simply counting visitors, GA4 shows how users move through your website and where they complete important actions.
Why Did Google Replace Universal Analytics?
For many years, businesses relied on Universal Analytics (UA). However, the way people browse the internet has changed.
Today, users switch between:
- Mobile phones
- Tablets
- Laptops
- Desktop computers
- Mobile apps
As privacy regulations have also evolved, tracking methods needed to change.
Google introduced GA4 to provide:
- Better privacy controls
- Event-based tracking
- Cross-device measurement
- AI-powered insights
- Predictive analytics
- Improved reporting
As a result, GA4 is now the standard analytics platform for websites worldwide.
Why Google Analytics 4 Matters in 2026?
Many website owners focus only on getting more traffic. However, traffic alone does not guarantee success.
What truly matters is understanding what visitors do after they arrive.
Google Analytics 4 helps answer important questions such as:
- Which marketing channel brings the highest-quality visitors?
- Which pages keep users engaged?
- Which pages have the highest drop-off rate?
- How many visitors become customers?
- Which devices do your visitors use?
- Which countries generate the most traffic?
- What content performs best?
When you understand these insights, you can make informed decisions that improve both user experience and business results.
Benefits of Using Google Analytics 4
Google Analytics 4 offers advantages for businesses of every size.
Better Understand Your Audience
GA4 helps you learn:
- Visitor locations
- Languages
- Devices
- Interests
- Age groups (when available)
- Returning vs. new users
This information helps you create content that better matches your audience’s needs.
Improve Your SEO
Google Analytics works well with Google Search Console.
Together, they help you:
- Identify pages with the most organic traffic
- Find pages with high engagement
- Improve underperforming content
- Monitor landing page performance
- Measure SEO progress over time
Although GA4 does not show keyword rankings directly, it provides valuable engagement data that complements Search Console.
Track Marketing Campaigns
If you advertise through:
- Google Ads
- Facebook Ads
- Email marketing
- WhatsApp campaigns
GA4 shows which campaigns drive the most valuable traffic. Instead of spending money blindly, you can invest more in campaigns that deliver results.
Measure Conversions
Every business has different goals.
Examples include:
- Contact form submissions
- Phone calls
- Product purchases
- Appointment bookings
- Newsletter sign-ups
- Demo requests
GA4 tracks these actions as conversions, allowing you to see which marketing efforts generate the highest return.
Improve User Experience
When users struggle to navigate your website, they often leave without taking action.
GA4 helps you identify:
- Slow-performing pages
- High-exit pages
- Low-engagement content
- Pages with declining traffic
By improving these areas, you can create a smoother experience that encourages visitors to stay longer.
Key Features of Google Analytics 4
Google Analytics 4 includes several powerful features designed for modern websites.
1. Event-Based Tracking
This is the biggest difference between GA4 and Universal Analytics.
Instead of tracking only pageviews, GA4 tracks meaningful interactions.
Examples include:
- Button clicks
- File downloads
- Video plays
- Scroll depth
- Form submissions
- Purchases
This approach provides a more complete understanding of user behavior.
2. Enhanced Measurement
One of GA4’s best features is Enhanced Measurement.
Once enabled, it automatically tracks several actions without requiring additional code.
These include:
- Page views
- Scrolls
- Outbound link clicks
- File downloads
- Video engagement
- Site search
This saves time while giving you richer data.
3. Cross-Platform Tracking
Many users begin browsing on one device and complete their journey on another.
For example:
- A customer discovers your website on a smartphone during lunch.
- Later that evening, they revisit it on a laptop.
- Finally, they make a purchase using a desktop computer.
GA4 helps connect these interactions, giving you a more complete view of the customer journey.
4. AI-Powered Insights
Google Analytics 4 uses machine learning to uncover trends and unusual activity.
For example, it can alert you when:
- Traffic suddenly increases
- Conversions drop unexpectedly
- Revenue changes significantly
- User engagement improves
These automated insights help you react quickly to important changes.
5. Predictive Metrics
GA4 can estimate future user behavior by analyzing historical data.
It may predict:
- Purchase probability
- Churn likelihood
- Potential revenue from users
While predictions are estimates, they can support smarter marketing decisions.
6. Custom Reports
Every business has unique goals.
GA4 allows you to create reports tailored to your needs.
You can analyze:
- Marketing performance
- User journeys
- Sales funnels
- Product performance
- Geographic trends
- Device usage
This flexibility makes GA4 suitable for blogs, eCommerce stores, SaaS companies, healthcare organizations, and service-based businesses.
Google Analytics 4 vs. Universal Analytics
| Feature | Google Analytics 4 | Universal Analytics |
| Data Model | Event-based | Session-based |
| Cross-device tracking | Yes | Limited |
| AI Insights | Yes | No |
| Predictive Metrics | Yes | No |
| Privacy Controls | Advanced | Basic |
| Mobile App Tracking | Excellent | Limited |
| Machine Learning | Built-in | Minimal |
| Future Support | Active | Discontinued |
For new websites, Google Analytics 4 is the recommended platform because it aligns with current privacy standards and provides more actionable insights.
Who Should Use Google Analytics 4?
GA4 is valuable for anyone who wants to understand and improve website performance, including:
- Small business owners
- Bloggers
- SEO professionals
- Digital marketers
- eCommerce store owners
- Healthcare providers
- Educational institutions
- SaaS companies
- Marketing agencies
- Enterprise organizations
Whether your goal is to increase traffic, generate leads, or boost sales, GA4 provides the data needed to make informed decisions.
How to Set Up Google Analytics 4 (GA4) Correctly
Setting up Google Analytics 4 (GA4) the right way is the first step toward collecting reliable website data. If your setup is incomplete, your reports may show incorrect traffic, missing conversions, or inaccurate user behavior.
Fortunately, the setup process is straightforward. Follow the steps below to create a GA4 property, install the tracking code, and configure the most important settings.
Before You Begin
Make sure you have:
- A Google account
- Access to your website
- Administrator access to your website or CMS
- Access to Google Tag Manager (optional but recommended)
If you use WordPress, you should also have administrator access to your dashboard.
Step 1: Create a Google Analytics 4 Property
Creating a GA4 property takes only a few minutes.
Follow These Steps
- Sign in to your Google Analytics account.
- Click Admin.
- Under the Account column, choose your account or create a new one.
- In the Property column, click Create Property.
- Enter your website name.
- Choose your reporting time zone.
- Select your currency.
- Click Next.
- Add your business details.
- Click Create.
Google will now create your GA4 property.
Step 2: Create a Data Stream
A data stream connects your website to Google Analytics.
To create one:
- Select Web.
- Enter your website URL.
- Enter your website name.
- Keep Enhanced Measurement turned on.
- Click Create Stream.
After creating the stream, Google generates a unique Measurement ID.
It looks like this:
G-XXXXXXXXXX
You will use this ID during installation.
What Is Enhanced Measurement?
Enhanced Measurement automatically tracks common user actions without extra coding.
It records:
- Page views
- Scrolls
- Outbound link clicks
- File downloads
- Video engagement
- Site searches
For most websites, keeping this feature enabled provides valuable insights with no additional setup.
Step 3: Install Google Analytics 4
There are several ways to install GA4.
The best option depends on your website platform.
Method 1: Install GA4 on WordPress
If your website uses WordPress, installation is simple.
Option A: Use Site Kit by Google
Site Kit is Google’s official WordPress plugin.
It lets you connect:
- Google Analytics
- Search Console
- AdSense
- PageSpeed Insights
- Tag Manager
Installation Steps
- Go to Plugins → Add New.
- Search for Site Kit by Google.
- Install and activate it.
- Sign in with your Google account.
- Connect your GA4 property.
- Complete the setup.
Your website will now begin sending data to Google Analytics.
Why Site Kit Is Recommended?
It offers several benefits:
- Easy setup
- Automatic verification
- No coding required
- Secure Google integration
- Displays analytics inside WordPress
Method 2: Install Using Google Tag Manager
Many marketers prefer Google Tag Manager (GTM) because it simplifies tracking and avoids direct code edits.
Steps
- Open Google Tag Manager
- Click New Tag.
- Choose Google Analytics: GA4 Configuration.
- Enter your Measurement ID.
- Set the trigger to All Pages.
- Save the tag.
- Publish the container.
From now on, GTM will send page view data to GA4.
Why Use Google Tag Manager?
Google Tag Manager makes it easier to:
- Add tracking codes
- Track button clicks
- Measure form submissions
- Track file downloads
- Set up custom events
- Manage marketing tags without editing website files
Method 3: Install Manually
If your website does not use WordPress or GTM, you can install GA4 manually.
Google provides a JavaScript tracking code.
Place it inside the <head> section of every page on your website.
This method works well for custom-built websites.
Step 4: Verify That GA4 Is Working
After installation, confirm that data is reaching your property.
Check the Real-Time Report
- Open Google Analytics.
- Select Reports.
- Click Realtime.
- Visit your website in another browser tab.
Within a few seconds, your visit should appear in the report.
If it does, your installation is successful.
Step 5: Configure Important Events
Events are the foundation of Google Analytics 4.
Every meaningful action can be tracked as an event.
Examples include:
- Contact form submissions
- Phone number clicks
- Email clicks
- Product purchases
- Newsletter sign-ups
- Video plays
- PDF downloads
Tracking these actions helps you understand how users interact with your website.
Recommended Events for Most Websites
| Website Type | Events to Track |
| Business Website | Contact form, phone click, email click |
| Blog | Scroll depth, newsletter signup, outbound links |
| E-commerce | Add to cart, checkout, purchase |
| Healthcare Website | Appointment booking, form submission |
| Educational Website | Course registration, brochure download |
| SaaS Website | Demo request, trial signup, account creation |
Tracking the right events gives you a clearer picture of user engagement and business performance.
Step 6: Mark Important Events as Conversions
Not every event is equally valuable.
Some actions directly support your business goals.
Examples include:
- Purchases
- Contact form submissions
- Appointment bookings
- Lead form completions
- Newsletter subscriptions
These should be marked as Conversions in GA4.
How to Mark an Event as a Conversion?
- Open Admin.
- Select Events.
- Find the event you want to measure.
- Turn on Mark as Conversion.
GA4 will now report how often users complete that action.
Step 7: Connect Google Search Console
Connecting Google Search Console with GA4 provides deeper SEO insights.
Once linked, you can compare:
- Organic traffic
- Landing pages
- User engagement
- Search performance
- Conversion data
This combination helps you identify pages that attract visitors but need better engagement or stronger calls to action.
Benefits of Linking Search Console
- Analyze organic traffic quality
- Find your best-performing landing pages
- Measure SEO improvements over time
- Understand how search visitors behave after arriving on your site
Step 8: Link Google Ads
If you run Google Ads campaigns, linking them to GA4 is essential.
You can track:
- Campaign performance
- User engagement
- Conversions
- Revenue
- Return on ad spend (ROAS)
With this data, you can optimize your advertising budget and improve campaign results.
Step 9: Filter Internal Traffic
Your own visits can distort analytics data.
For example, employees may visit your website frequently, making traffic appear higher than it really is.
GA4 lets you filter internal traffic based on IP addresses or other rules, helping you maintain cleaner reports.
Step 10: Enable Google Signals
Google Signals provides additional insights when users have consented to personalized experiences.
It can improve reporting for:
- Cross-device activity
- Demographics
- Interests
- Remarketing audiences
Always ensure your website complies with applicable privacy regulations and obtains user consent where required.
Common GA4 Setup Mistakes
Avoid these common issues:
- Installing multiple tracking codes on the same page
- Forgetting to verify the installation
- Not configuring key conversion events
- Ignoring Enhanced Measurement
- Leaving internal traffic unfiltered
- Not linking Search Console
- Not linking Google Ads
- Failing to test events after setup
Checking your setup early saves time and ensures accurate data.
Quick Setup Checklist
Use this checklist before relying on your reports:
- ✔️ Created a GA4 property
- ✔️ Added a web data stream
- ✔️ Installed the tracking code
- ✔️ Verified data in the Realtime report
- ✔️ Enabled Enhanced Measurement
- ✔️ Configured important events
- ✔️ Marked key events as conversions
- ✔️ Linked Google Search Console
- ✔️ Linked Google Ads (if applicable)
- ✔️ Filtered internal traffic
- ✔️ Enabled Google Signals (where appropriate)
Completing these steps lays a strong foundation for reliable analytics.
The Main Sections in Google Analytics 4
GA4 organizes reports into a few simple categories.
These include:
- Home
- Realtime
- Acquisition
- Engagement
- Monetization (for eCommerce websites)
- Retention
- User Attributes
- Tech Reports
- Explore
Each report answers a different question about your website.
1. Home Report
The Home Report gives you a quick overview of your website.
It displays key metrics such as:
- Active users
- New users
- Total events
- Conversions
- Revenue (if configured)
- Recent traffic trends
Why It Matters
The Home report helps you spot sudden changes in website performance.
For example:
- A traffic spike after publishing a new blog.
- A drop in visitors after a website update.
- Increased conversions after launching a marketing campaign.
Checking this report daily helps you stay informed.
2. Realtime Report
The Realtime Report shows what is happening on your website right now.
You can see:
- Active users
- Their locations
- Devices they use
- Pages they are viewing
- Events they trigger
- Traffic sources
When Should You Use It?
The Realtime report is especially useful after:
- Publishing a new blog
- Launching Google Ads
- Sending an email campaign
- Sharing content on social media
- Updating your website
If visitors do not appear in the report, there may be an issue with your tracking setup.
3. Acquisition Reports
One of the most valuable reports in Google Analytics 4 is Acquisition.
It tells you how visitors found your website.
You can identify traffic from:
- Organic Search
- Direct visits
- Paid Search
- Social Media
- Email campaigns
- Referral websites
Why Acquisition Matters
Suppose your website receives:
- 10,000 visitors from Google Search
- 500 visitors from Facebook
- 200 visitors from LinkedIn
Although Google sends the most visitors, Facebook users may spend more time on your website and convert at a higher rate.
GA4 helps you compare both traffic quantity and quality.
Traffic Acquisition Report
This report shows:
- Sessions
- Engaged sessions
- Average engagement time
- Event count
- Conversions
Questions It Answers
- Which marketing channel performs best?
- Which campaigns generate leads?
- Which traffic source has the lowest bounce-like behavior?
- Which channels deserve more investment?
User Acquisition Report
While Traffic Acquisition focuses on sessions, User Acquisition focuses on first-time visitors.
It helps answer questions such as:
- How do new users discover your website?
- Which channels bring the most first-time visitors?
- Which marketing strategy attracts new audiences?
This information is valuable for business growth.
4. Engagement Reports
The Engagement section shows how users interact with your website.
This is one of the most important areas for SEO.
Google wants websites that provide a positive user experience.
Strong engagement often indicates valuable content.
Pages and Screens Report
This report displays:
- Most viewed pages
- Average engagement time
- Views per page
- Event count
- Conversions
Use This Report to Find
- Your best-performing blog posts
- Popular service pages
- Low-performing content
- Pages that need updating
Example
Imagine your blog has these pages:
| Page | Monthly Views |
| SEO Guide | 6,500 |
| Google Ads Guide | 4,800 |
| Email Marketing | 1,900 |
| Instagram Marketing | 950 |
The SEO Guide clearly attracts the most visitors.
You can improve results further by:
- Updating the article
- Adding new examples
- Improving internal links
- Including stronger calls to action
Refreshing successful content often delivers better results than creating new content from scratch.
Average Engagement Time
This metric shows how long users actively interact with your content.
High Engagement Usually Means
- Useful content
- Easy readability
- Good page layout
- Strong user experience
Low Engagement May Indicate
- Poor introductions
- Slow page speed
- Weak content
- Misleading titles
- Irrelevant search intent
Events Report
Events track actions users perform.
Examples include:
- Button clicks
- Form submissions
- Video plays
- PDF downloads
- Phone calls
- Purchases
If many visitors click your “Contact Us” button, your content is successfully encouraging action.
Conversion Report
Conversions measure important business goals.
Examples include:
- Contact form submissions
- Appointment bookings
- Product purchases
- Newsletter sign-ups
- Quote requests
Instead of focusing only on traffic, monitor how many visitors become customers or leads.
5. Landing Page Report
Landing pages are often the first pages users see after clicking a search result or advertisement.
This report helps you identify:
- Pages attracting the most visitors
- Pages with strong engagement
- Pages that generate conversions
- Pages that need optimization
How to Improve Landing Pages
If a landing page has:
High traffic but low conversions:
- Improve your headline.
- Add trust signals.
- Simplify your contact form.
- Include customer testimonials.
- Strengthen your call to action.
Low traffic but high conversions:
- Improve SEO.
- Build backlinks.
- Share the page on social media.
- Create supporting blog content.
6. User Reports
User reports help you understand your audience.
You can analyze:
- Countries
- Cities
- Languages
- Age groups (where available)
- Interests
- Devices
Geographic Data
Suppose your audience comes from:
| Country | Users |
| India | 55% |
| United States | 22% |
| Canada | 9% |
| United Kingdom | 7% |
| Australia | 4% |
This information can guide your content strategy.
For example:
- Publish content during your audience’s active hours.
- Use region-specific examples.
- Offer location-based services when appropriate.
Device Report
Visitors use different devices.
Common categories include:
- Mobile
- Desktop
- Tablet
If most visitors use smartphones, your website must be fully mobile-friendly.
Example
Imagine your website receives:
- 75% mobile users
- 20% desktop users
- 5% tablet users
In this case, improving the mobile experience should be a top priority.
Focus on:
- Fast loading speed
- Readable fonts
- Responsive layouts
- Easy navigation
- Click-friendly buttons
7. Tech Reports
Tech reports provide technical details about your visitors.
You can see:
- Browser types
- Operating systems
- Screen resolutions
- Device categories
If users experience problems with a specific browser, this report can help you identify the issue.
8. Explore Reports
The Explore section is one of GA4’s most powerful features.
It allows you to create custom reports tailored to your business goals.
You can build reports for:
- User journeys
- Marketing funnels
- Customer segments
- Purchase paths
- Event analysis
Although it may seem advanced at first, Explore becomes invaluable as your analytics needs grow.
SEO Metrics You Should Monitor Every Week
If your goal is to improve search rankings, pay close attention to these metrics:
| Metric | Why It Matters |
| Organic Users | Measures SEO traffic growth |
| Landing Pages | Identifies high-performing content |
| Engagement Time | Indicates content quality |
| Conversions | Shows business impact |
| Returning Users | Reflects audience loyalty |
| Events | Measures user interactions |
| Scroll Depth | Indicates how much content users read |
| Traffic Sources | Reveals which channels drive visitors |
Tracking these metrics consistently helps you measure the success of your SEO efforts.
Common Reporting Mistakes
Avoid these common mistakes when analyzing GA4 data:
- Looking only at page views.
- Ignoring conversion data.
- Focusing on daily fluctuations instead of long-term trends.
- Comparing different date ranges without context.
- Making major decisions based on a single report.
- Forgetting to segment traffic by source or device.
Use multiple reports together to gain a complete understanding of your website’s performance.
Real-World Example
A digital marketing agency noticed that one of its blog posts received over 8,000 monthly visitors, but generated very few inquiries.
After reviewing the Landing Page and Events reports, the team discovered that visitors were reading the article but not clicking the contact button.
They made several improvements:
- Added a stronger call to action near the top.
- Included client success stories.
- Reduced the contact form from eight fields to four.
- Improved internal links to related services.
Within two months:
- Contact form submissions increased by 35%.
- Average engagement time rose by 22%.
- Bounce-like behavior decreased significantly.
The traffic stayed the same, but the website generated more business because the data guided meaningful improvements.
Best Practices for Reading GA4 Reports
Follow these habits to get more value from Google Analytics:
- Review reports every week.
- Compare current performance with previous periods.
- Track both traffic and conversions.
- Monitor your most important landing pages.
- Test one improvement at a time.
- Record major website changes so you can connect them to performance trends.
Small, consistent improvements often produce the best long-term results.
Advanced Google Analytics 4 Features
1. Explorations
Explorations is one of the most powerful sections in GA4.
It allows you to create custom reports that answer specific business questions.
For example, you can discover:
- Which pages lead to the most conversions
- How users move through your website
- Which devices generate the highest revenue
- Which traffic sources keep users engaged the longest
Unlike standard reports, Explorations lets you analyze your data from multiple angles.
Popular Exploration Templates
- Funnel Exploration
- Path Exploration
- Segment Overlap
- User Explorer
- Cohort Exploration
- Free Form Analysis
If you want deeper insights, Explorations is the place to start.
Funnel Exploration
A funnel shows how users move through a sequence of steps.
For example:
Website Visit
↓
Product Page
↓
Add to Cart
↓
Checkout
↓
Purchase
If many users leave during the checkout stage, you know where improvements are needed.
How Funnel Reports Help?
They help you:
- Find drop-off points
- Improve conversion rates
- Simplify checkout processes
- Increase lead generation
- Improve customer experience
Even small improvements in a funnel can significantly increase conversions.
Path Exploration
Path Exploration shows how users navigate through your website.
For example:
Home Page
↓
Services Page
↓
Pricing Page
↓
Contact Page
↓
Lead Form
You can also see where users leave your website.
This helps you identify pages that need better navigation or stronger calls to action.
Segment Comparison
Different visitors behave differently.
Segment Comparison allows you to compare users based on:
- Device
- Country
- Traffic source
- Returning visitors
- New visitors
- Campaign source
For example, you may find that:
- Mobile users spend less time on your website.
- Organic visitors convert more often than social media visitors.
- Returning users are more likely to complete a purchase.
These insights help you create targeted improvements.
Predictive Metrics
Google Analytics 4 uses machine learning to estimate future user behavior.
Available predictive metrics may include:
- Purchase probability
- Churn probability
- Predicted revenue
Although predictions are not guarantees, they help businesses identify high-value audiences and prioritize marketing efforts.
Audiences
Audiences allow you to group visitors based on their behavior.
Examples include:
- Users who visited more than three pages
- Visitors who abandoned their shopping cart
- Returning customers
- High-value buyers
- Newsletter subscribers
- Visitors who viewed pricing pages
You can use these audiences for remarketing campaigns in Google Ads and other marketing platforms.
Custom Events
Enhanced Measurement tracks many actions automatically, but sometimes you need to measure actions unique to your website.
Examples include:
- Clicking the “Request a Demo” button
- Downloading a pricing guide
- Watching 75% of a product video
- Using a cost calculator
- Booking an appointment
Custom events help you measure interactions that matter most to your business.
Using Google Analytics 4 for SEO
Google Analytics 4 does not directly show keyword rankings. However, it provides valuable insights into how users interact with your content after they arrive from search engines.
Monitor Organic Traffic
Review your organic traffic regularly to understand whether your SEO efforts are producing results.
Look for trends over weeks and months rather than focusing on daily changes.
Identify High-Performing Content
Find pages that:
- Receive consistent organic traffic
- Keep visitors engaged
- Generate leads or sales
- Attract returning users
These pages deserve regular updates to maintain and improve their rankings.
Improve Low-Performing Pages
Pages with:
- Low engagement
- Few conversions
- High exit rates
may need improvements such as:
- Better headlines
- Updated information
- Faster loading speed
- Clearer calls to action
- More internal links
Measure Content Performance
Every article should have a purpose.
Measure:
- Views
- Engagement time
- Scroll depth
- Conversions
- Returning visitors
If a page receives traffic but fails to convert, review its content, structure, and calls to action.
Google Analytics 4 Best Practices
Follow these best practices to get the most value from GA4.
Review Reports Regularly
Do not wait until traffic drops.
Instead:
- Review weekly reports.
- Monitor monthly trends.
- Compare performance over time.
Consistent monitoring helps you identify issues early.
Set Meaningful Conversions
Track actions that support your business goals.
Examples include:
- Contact form submissions
- Product purchases
- Appointment bookings
- Quote requests
- Newsletter sign-ups
Avoid tracking unnecessary events as conversions.
Use UTM Parameters
UTM parameters help identify where visitors come from.
For example, they allow you to distinguish traffic from:
This makes campaign reporting much more accurate.
Keep Internal Traffic Separate
Exclude visits from employees and developers whenever possible.
Doing so helps keep your reports focused on real customer behavior.
Combine GA4 with Other Google Tools
Google Analytics becomes even more useful when connected with:
- Google Search Console
- Google Ads
- Google Tag Manager
- Looker Studio
These integrations provide a more complete view of website performance and marketing effectiveness.
Common Google Analytics 4 Mistakes
Many businesses install GA4 but never use it effectively.
Avoid these common mistakes:
- Ignoring conversion tracking
- Never checking reports
- Looking only at page views
- Failing to update events after website changes
- Making decisions based on a single day’s data
- Forgetting to test tracking after updates
- Not reviewing mobile performance
Avoiding these mistakes leads to more reliable insights and better decisions.
Case Study: Improving Lead Generation with GA4
A software company received approximately 15,000 monthly visitors, but generated only 80 leads.
The marketing team used GA4 to investigate.
What They Found
- Many visitors left after reading the pricing page.
- Mobile users experienced shorter engagement times.
- The contact form required too many fields.
- The main call-to-action button appeared too far down the page.
Improvements Made
- Simplified the contact form.
- Added customer testimonials near the pricing section.
- Moved the call-to-action button higher on the page.
- Improved mobile page speed.
- Added internal links to relevant case studies.
Results After Three Months
- Lead generation increased by 42%.
- Mobile engagement improved by 30%.
- Average session engagement increased.
- More visitors completed contact forms.
The company achieved better results without increasing advertising spend. They simply used analytics to improve the user experience.
Frequently Asked Questions (FAQs)
1.Is Google Analytics 4 free?
Yes. Google Analytics 4 is free for most websites and includes powerful reporting, event tracking, and audience insights.
2. Can beginners use Google Analytics 4?
Yes. While GA4 includes advanced features, beginners can start with the Home, Acquisition, Engagement, and Realtime reports.
3. Does Google Analytics 4 improve SEO?
GA4 does not directly improve rankings. However, it helps you understand user behavior, measure engagement, and identify opportunities to improve content and user experience, which can support your SEO strategy.
4.What is the difference between Google Analytics and Google Search Console?
Google Analytics focuses on what users do after they visit your website.
Google Search Console focuses on how users find your website in Google Search.
Using both tools together provides a more complete picture of your website’s performance.
5.How often should I check Google Analytics?
For most websites:
- Review key reports weekly.
- Analyze trends monthly.
- Conduct a deeper performance review every quarter.
6.Which GA4 reports are most important?
Start with:
- Realtime
- Traffic Acquisition
- User Acquisition
- Pages and Screens
- Landing Pages
- Events
- Conversions
- Explore
These reports provide the most actionable insights for beginners and marketers.
7.Can GA4 track eCommerce sales?
Yes. GA4 supports enhanced eCommerce tracking, allowing you to monitor product views, add-to-cart actions, checkouts, purchases, and revenue.
Final Thoughts
Google Analytics 4 is more than a website traffic tool. It helps you understand your visitors, measure marketing performance, improve user experience, and make informed business decisions.
Instead of relying on assumptions, GA4 provides the data you need to refine your SEO, optimize campaigns, and increase conversions.
Success does not come from collecting data alone. It comes from reviewing your reports regularly, testing improvements, and acting on the insights you discover.
Conclusion
Whether you manage a personal blog, a local business website, an online store, or a large enterprise, Google Analytics 4 is an essential tool for understanding how your website performs.
By following the steps in this guide, you can:
- Set up GA4 correctly
- Track meaningful events and conversions
- Analyze traffic sources
- Improve your SEO strategy
- Understand user behavior
- Optimize marketing campaigns
- Increase leads and sales
- Make smarter, data-driven decisions
Remember that analytics is an ongoing process. Continue monitoring your reports, testing changes, and refining your website based on real user behavior. Over time, these consistent improvements can lead to stronger rankings, better engagement, and sustainable business growth.
Ready to Turn Data Into Growth?
Installing Google Analytics 4 is only the first step. The real value comes from using its insights to improve your website, create better content, and deliver a better experience for your visitors.
Start reviewing your reports today, make one improvement at a time, and measure the results. Small, consistent changes based on accurate data can lead to meaningful growth in traffic, engagement, and conversions over time. Contact AdsnSEO for best digital marketing services in Hyderabad